2019: Is the Economic Cycle Turning Downward?
As 2018 came to a close, fears that the yield curve might invert and signal an impending U.S. recession, Federal Reserve policy inflexibility, and concerns about trade barriers sparked a year-end stock market sell-off. Apple Inc.’s downward outlook guidance for the quarter, along with commentary on lower-than-expected demand in China, further fueled the downward draft. The question for 2019 is whether the year-end data does, in fact, portend an upcoming recession. Below we discuss our conclusion that while growth in the U.S. economy is slowing, our 2019 macroeconomic outlook calls for continued U.S. growth, albeit at less than 3% annually, and slowly rising interest rates. We believe financial market volatility, which may be preceded by economic and/or geopolitical shocks, will continue, and opportunities will arise to buy quality companies at discounted prices for longer-term value.
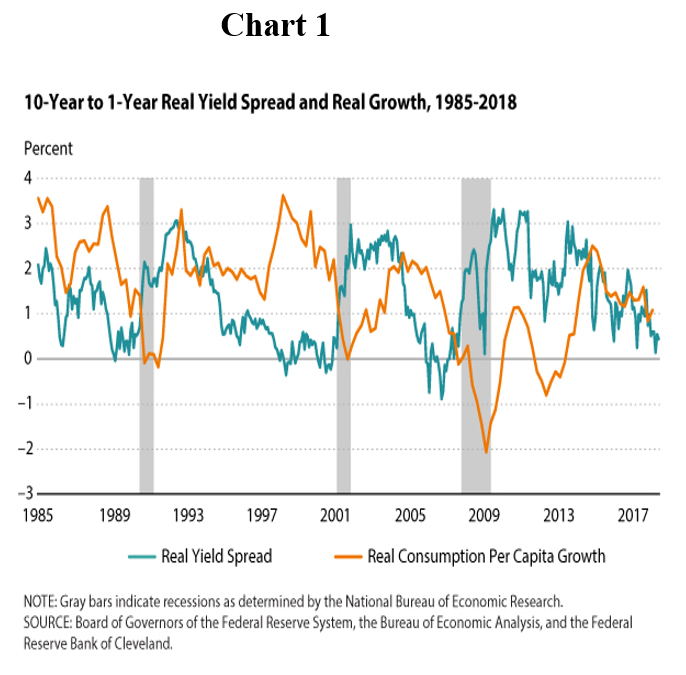
The Yield Curve: The three most recent recessions that were preceded by an inverted yield curve occurred in 1990, 2001, and 2007-2009. The recession in 1990 was to a large extent caused by the Iraqi invasion of Kuwait and the associated spike in world oil prices. The approaching causes of the latter recessions were asset-price collapses. The 2001 recession was comparatively mild. The 2007-2009 recession was more severe, partially due to the fact that the economy was already growing slowly when real estate prices collapsed. The chart in the next column (Chart 1) shows the overlay of consumption growth and the ten-year to one-year real yield spread. Unless the U.S. economy materially slows from here, we believe an economic shock would more reasonably lead to a slowdown, but not a deep recession.
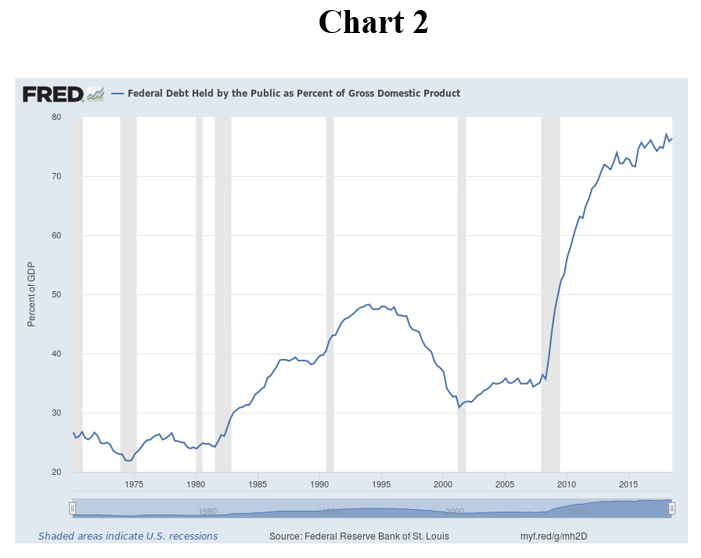
The Budget Deficit: According to the U.S. Congressional Budget Office, the baseline estimate for the U.S. budget deficit in 2020 will grow to greater than $1.0 trillion. With public debt as a percentage of GDP at 77.8% at year-end 2018 (Chart 2), the baseline estimate has it rising to 96% by 2028. Levels of public debt approaching 100%, with foreign ownership at about 35% of the public debt outstanding currently, leave the United States increasingly vulnerable to exogenous factors. We believe that the progress on the primary deficit (budget deficit not including interest payments) will be one of the most important economic data points to watch in 2019. Importantly, capital investments initiated in response to the Tax Cuts and Jobs Act should benefit potential GDP, in turn benefitting the deficit, over time. Ultimately, substantive increased revenues or reduced government outlays, or a combination of both, will need to be addressed to reduce the growing budget deficit.
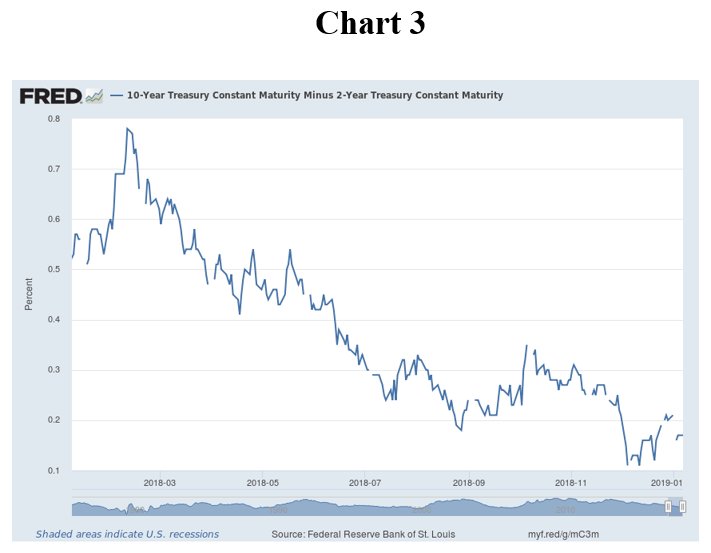
Market Volatility and Asset Valuations:, The year-end economic and geopolical unrest culminated on December 24, 2018, with the VIX volatility measure more than doubling to 36 from approximately 16 on December 3, 2018. In early 2019, Chairman Powell assuaged fears of steadfast, mechanical rate rises and balance sheet roll off. The 10-year to 2-year Treasury Constant Maturity yield spread widened (Chart 3), and slowing economic data was revisited as “slowing growth”. In addition, U.S. – China trade talks started to show signs of positive progress. The financial markets have responded positively to Chairman Powell’s comments, as well as the decline in interest rates and lower equity valuations.
U.S. public debt, however, remains at notably high levels with no simple solution, and geopolitics remain in flux. We believe financial markets in 2019 will experience continued volatility.
Importantly, volatility in financial assets provides opportunities to buy great companies on downdrafts and cull portfolios on upswings. This applies to individual bonds as well, as interest rates respond to changing economic growth expectations. Individual high quality stocks, which may get caught in market downdrafts, can potentially turn into buying opportunities not available if one chooses Exchange Traded Funds (ETFs) or mutual funds, which hold a basket of stocks and/or bonds. Individual companies with strong leadership, strong ecosystems for long-term growth potential, and flexible balance sheets which come down in price during periods of volatility may present recurring opportunties over the balance of 2019. With the S&P 500 currently valued at about a 15 times price-to-estimated-2019-earnings multiple and interest rates having moved lower, we find an expanded array of possibilities relative to just a couple months ago.
Differentiation: At Allen Trust Company, we believe one of our differentiating factors is our preference for individual stocks and bonds. While mutual funds offer broad market or sector diversification, individual stocks and bonds enable us to build portfolios one stock and one bond at a time grounded in client financial goals and investment objectives. Balance sheets, cash flow generation capability, management excellence, and historical and future potential growth opportunities, as well as competitive advantages, are factored into our investment analysis. The companies that meet our criteria often screen as “value”, but that “value” often has a “growth” component to it. We tend to hold investments for long periods of time so long as the investment thesis continues to unfold and improve. Importantly, individual stocks and bonds in Allen Trust Company portfolios enable more precise and detailed insight into asset allocation and portfolio tax implications relative to mutual funds and ETFs.
Every year brings new opportunties and challenges. We strive each year and over the longer term to build durable portfolios that reflect each client’s financial goals and investment objectives.